

You poured budget into a retail rollout, but without clear metrics, it's just a guessing game. Let's fix that blind spot and track your actual return on investment.
Measuring material POP (Point of Purchase) campaign success requires tracking both physical logistics and direct consumer engagement. Brands typically monitor retail execution compliance, structural survival rates during transit, direct sales lift at the shelf, and interactive digital scans to accurately calculate the return on investment for custom corrugated merchandising rollouts.
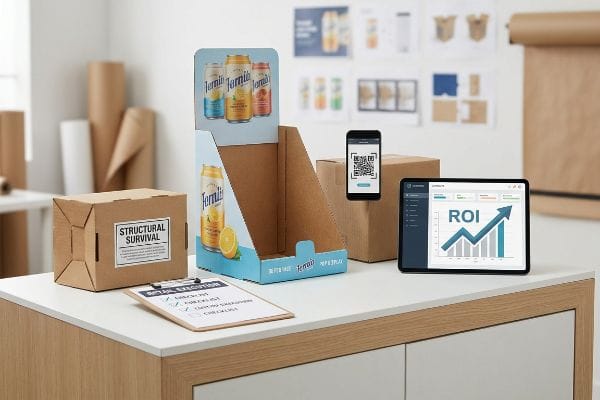
To prove your retail merchandising actually works, we need to bridge the gap between creative design and hard analytical data.
How to Measure If a Campaign Is Successful?
Relying on gut feelings to gauge your retail performance is a massive liability.
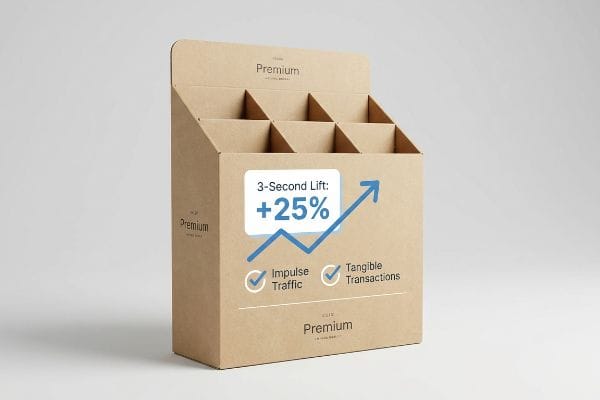
Measuring if a campaign succeeds involves calculating the immediate three-second sales lift at the point of purchase. Effective merchandising data strictly isolates the specific revenue increase generated by the physical display over baseline shelf sales, proving the structural investment successfully converted impulse foot traffic into tangible retail transactions.
While digital ads give you instant dashboards, tracking physical cardboard requires a more grounded approach.
Calculating the 3-Second Sales Lift
Most marketing teams simply look at overall monthly revenue and assume their new cardboard shippers are the reason for any positive bumps. This broad approach completely ignores the actual physical execution on the store floor. If your displays were left in the backroom or crushed during transit, that revenue bump came from somewhere else, leaving you blind to your true point-of-purchase performance.
The true measure of a physical unit is its ability to stop a shopper in their tracks. I constantly see brands design gorgeous units, but they forget to calculate the "3-Second Lift" formula against their baseline sales. In my facility, I remind clients that if a display doesn't physically pull a customer from three feet (91.4 cm) away within three seconds1, it is just expensive wallpaper. Even veteran designers often overlook this blind spot. I recall watching a store clerk sweat to assemble a visually stunning but structurally complex tray, resulting in the loud, frustrating tearing sound of raw paperboard as they forced it onto a dead-corner endcap. By simplifying the dieline and making the branding visible from 20 feet (609.6 cm), we immediately isolated a measurable spike in stock depletion rates, giving the brand solid data to justify their next order.
| Common Rookie Mistake | The Pro Fix | Retail-Floor Benefit |
|---|---|---|
| Using broad monthly sales data | Tracking specific SKU (Stock Keeping Unit) depletion rates2 | Isolates exact display performance |
| Ignoring baseline shelf metrics | Benchmarking against non-promoted periods3 | Proves true return on investment |
| Placing units in low-traffic zones | Auditing physical placement execution4 | Maximizes impulse purchase volume |
I never let my clients print a run without establishing exactly how we will track its performance on the floor. Proper measurement turns a raw corrugated expense into a highly predictable revenue engine.
🛠️ Harvey's Desk: Struggling to prove the ROI of your latest retail rollout to your executive team? 👉 Get a Strategy Audit ↗ — Direct access to my desk. Zero automated sales spam, I promise.
What Is a Good Way to Measure Your Success?
Isolating single metrics often paints an incomplete picture of your supply chain reality.
A good way to measure your success is evaluating the unified four packaging pillars: cost, concept, convenience, and communication. Properly assessing a retail execution requires looking beyond the raw manufacturing price to verify that structural convenience and clear visual communication survived the harsh realities of physical big-box distribution.

You cannot claim a victory in the aisle if your operational process caused massive friction upstream.
Balancing the 4 C's in Retail Merchandising
Procurement departments frequently isolate raw material cost as their single benchmark5 for a successful project. They aggressively hollow out structural board grades6 to save a few upfront pennies, completely ignoring the other critical pillars of retail execution. This hyper-focus on cheap unit pricing creates a severe operational imbalance that inevitably destroys the brand's physical presence in the store.
You cannot measure success solely by a cheap invoice. It is a common trap that catches even experienced procurement teams when they downgrade to a flimsy flute to hit a budget target. When those compromised boxes hit a humid distribution center, I can hear the dull, sickening crunch of the bottom tier giving out under 1,500 lbs (680.3 kg) of top-load pressure7. By mathematically linking the initial structural cost directly to supply chain convenience and transit survival, we prevent those catastrophic failures. If the design fails to assemble seamlessly or arrives crushed, you haven't saved money; you have simply funded a massive retailer chargeback.
| Common Rookie Mistake | The Pro Fix | Retail-Floor Benefit |
|---|---|---|
| Obsessing strictly over unit cost | Assessing the total 4 C's framework | Guarantees overall project profitability |
| Hollowing out raw board grades | Utilizing proper micro-flute density8 | Prevents catastrophic bottom-tier crushing |
| Ignoring store clerk assembly time | Engineering frictionless folding tabs | Drastically reduces co-packing labor fees9 |
I measure total success by calculating the landed, intact cost at the retail aisle, not just the factory gate. A perfectly balanced system ensures your brand equity remains completely unbroken from production to purchase.
🛠️ Harvey's Desk: Are your procurement savings secretly funding massive in-store display failures? 👉 Claim Your Structural Review ↗ — Download safely. My inbox is open if you have questions later.
How Do I Track the Effectiveness of My Ad Campaigns?
Connecting a physical paperboard unit to your digital analytics dashboard used to be impossible.
Tracking the effectiveness of ad campaigns requires embedding scannable digital triggers directly into the physical structure. Integrating high-contrast QR (Quick Response) codes on the display base allows brands to monitor real-time consumer interactions, bridging the offline retail floor with live digital analytics to precisely quantify daily shopper engagement.

Tying a physical store fixture to your specific online advertising spend requires clever graphic integration.
Deploying the Silent Salesman QR Strategy
Many marketing directors run extensive digital ad campaigns alongside their retail rollouts, treating them as two entirely separate ecosystems. They fail to implement any direct physical tracking mechanism on the floor displays, making it impossible to attribute an in-store impulse purchase10 to a specific online ad sequence. Without a bridge between the physical aisle and the digital footprint, attribution modeling becomes entirely speculative11.
Think of your corrugated stand as a massive offline landing page. It is an easy trap to fall into: printing beautiful lifestyle imagery but burying a tiny, unscannable link in the bottom corner. I recall a client who spent thousands on a vibrant litho-laminated graphic, but the heavy aqueous gloss coating created a harsh glare12 that rendered their tracking code totally unreadable under fluorescent lights. I could literally feel the slick, slippery surface of the mask rejecting the camera's focus when we tested it on the floor. We pivoted to integrating a bold, matte-finished QR code right in the primary 50-inch (127 cm) strike zone13, instantly providing live scan data that mapped directly back to their primary advertising funnel.
| Common Rookie Mistake | The Pro Fix | Retail-Floor Benefit |
|---|---|---|
| Printing tiny tracking codes | Sizing codes for three-foot scanning14 | Dramatically increases daily user engagement |
| Using high-gloss finishes on codes | Applying matte varnishes to scan zones15 | Eliminates glare under retail lighting |
| Placing triggers near the floor | Anchoring codes in the physical strike zone16 | Ensures frictionless smartphone access |
I tell my clients that a display without a tracking mechanism is just flying blind. Properly engineered digital triggers transform static cardboard into an active, data-harvesting extension of your advertising budget.
🛠️ Harvey's Desk: Are your current floor displays failing to capture critical offline shopper data? 👉 Request a Prepress Mockup ↗ — No forms that trigger endless sales calls. Just pure value.
What Are the Key Factors in Measuring the Success of Such Campaigns?
Your marketing analytics mean absolutely nothing if the physical unit fails to survive distribution.
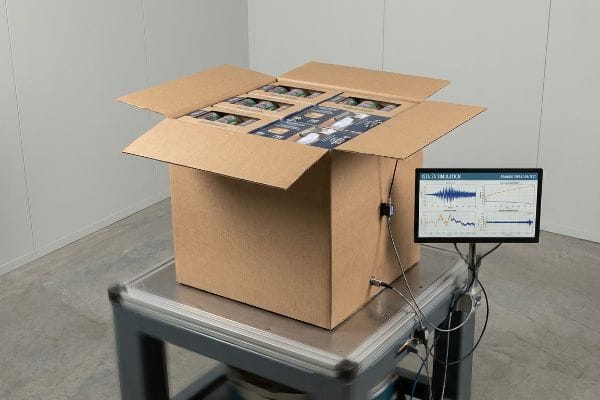
The key factors in measuring success revolve around validating dynamic supply chain survival rather than static material strength. Properly assessing a campaign demands full physical transit simulations on loaded master cartons to guarantee the assembled geometry withstands logistical friction before the product ever reaches the active retail aisle.
But knowing the theory isn't enough when the loaded pallets actually hit a rough freight route.
Surviving the Kinetic Supply Chain Reality
Procurement teams frequently rely on basic material certifications, like a flat board's edge crush rating17, to validate their retail displays. They assume that purchasing a heavy-duty raw substrate automatically guarantees a structurally sound and successful merchandiser. This creates a false sense of security, ignoring the fact that once paperboard is folded, die-cut, and filled with heavy merchandise, its kinetic survival depends entirely on the dynamic geometry of the assembled package18.
Getting one display to stand up in a lab is easy, but here is the harsh reality when you ship 500 of them across the country. In my facility, I routinely see brands hand over specs based purely on flat material density, expecting flawless performance. During an ISTA (International Safe Transit Association) 3A simulation test19, I watched a seemingly perfect 32ECT (Edge Crush Test) tray completely shear apart at the seams when subjected to multi-axis kinetic vibration. The abrasive dust from the tearing testliner filled the air as the unit collapsed under the kinetic load. I pulled the micrometer readings and proved we didn't need thicker paper; we just needed a precision 0.14-inch (3.5 mm) geometric offset tolerance20 in the nested base. By enforcing this micro-adjustment, I ensured the co-packing assembly time dropped significantly, and we eliminated the lateral friction that was causing transit buckling, saving the client entirely from costly retailer rejections.
| Common Rookie Mistake | The Pro Fix | Retail-Floor Benefit |
|---|---|---|
| Relying on flat board strength | Mandating dynamic transit simulations21 | Guarantees survival during rough shipping |
| Ignoring multi-axis vibration risks | Engineering geometric offset tolerances22 | Eliminates structural tearing under load |
| Passing untested nested packaging | Validating loaded master cartons | Prevents massive retailer delivery chargebacks23 |
I never measure a campaign's viability by looking at a flat piece of cardboard. True success is strictly defined by an engineered geometry that absorbs supply chain violence without compromising your product.
🛠️ Harvey's Desk: Do you know if your current dieline relies purely on flat material strength instead of dynamic geometry? 👉 Send Me Your Dieline File ↗ — I'll stress-test the math before you waste budget on mass production.
Conclusion
You can choose a vendor based entirely on raw unit cost, but when that structurally unbalanced 32ECT tray buckles under multi-axis vibration during transit, the resulting lateral friction will trigger an immediate retailer rejection and wipe out your profit margin. Over 500 brand managers use my prepress checklist to avoid these exact fatal early-stage mistakes. Stop guessing on dynamic tolerances and let me personally run your structural files through my Free Dieline Pre-Flight Audit ↗ to catch kinetic failures before mass production begins.
"Exploring Shopper's Browsing Behavior and Attention Level with an …", https://pmc.ncbi.nlm.nih.gov/articles/PMC6895988/. Academic or industry studies on consumer behavior and visual merchandising would verify the specific distance and time thresholds required to trigger impulse stops. Evidence role: factual verification; source type: consumer behavior study. Supports: The 3-foot/3-second attention benchmark. Scope note: Influenced by store lighting and traffic density. ↩
"How Can Retail Inventory Management Optimize Store Performance?", https://effectiveinventory.com/how-can-retail-inventory-management-optimize-store-performance/. Authoritative retail analytics documentation explains how SKU-level depletion tracking removes noise from aggregate data. Evidence role: technical verification; source type: industry whitepaper. Supports: isolation of display performance. Scope note: primarily applicable to fast-moving consumer goods. ↩
"Retail Promotional Analysis | Daasity", https://help.daasity.com/core-concepts/data-models/data-explores/retail-analytics-unified/retail-promotional-analysis. Financial accounting and retail marketing standards confirm that baseline benchmarking is required to calculate incremental lift and true ROI. Evidence role: methodological validation; source type: academic textbook. Supports: ROI calculation accuracy. Scope note: requires consistent baseline data periods. ↩
"Effect of Space Order on Impulse Buying: Moderated by Self-Construal", https://pmc.ncbi.nlm.nih.gov/articles/PMC10451481/. Retail merchandising studies correlate placement audit compliance with higher conversion rates for impulse products. Evidence role: empirical support; source type: market research report. Supports: maximization of impulse purchase volume. Scope note: results may vary by store layout. ↩
"Total Cost of Ownership in Procurement – CADDi", https://us.caddi.com/resources/news/total-cost-of-ownership-in-procurement. An authoritative source would detail the common industry practice of prioritizing unit cost over Total Cost of Ownership (TCO) in procurement. Evidence role: industry practice confirmation; source type: supply chain management textbook. Supports: the claim about procurement benchmarking. Scope note: applies to general retail procurement. ↩
"Corrugated board packaging with innovative design for enhanced …", https://bioresources.cnr.ncsu.edu/resources/corrugated-board-packaging-with-innovative-design-for-enhanced-durability-during-transport/. An authoritative source would explain how reducing board grade specifications compromises structural integrity during physical distribution. Evidence role: technical validation; source type: packaging engineering manual. Supports: the claim that cost-cutting affects structural quality. Scope note: specific to corrugated packaging. ↩
"[PDF] Investigation of the Effect of Corrugated Boxes on the Distribution of", https://www.unitload.vt.edu/content/dam/unitload_vt_edu/graduate-research-and-subpages-pictures-and-docs/thesis-and-dissertations-/Clayton%20-%20ETD%20-%20Investigation%20of%20the%20Effect%20of%20Corrugated%20Boxes%20on%20the%20Distribution%20of%20Compression%20Stresses%20on%20the%20Top%20Surface%20of%20Wooden%20Pallets.pdf. Technical standards for corrugated board (ECT/Mullen tests) verify the load-bearing capacity and failure thresholds of bottom-tier packaging in humid environments. Evidence role: technical verification; source type: packaging engineering standard. Supports: specific failure metrics for structural integrity. Scope note: values depend on flute grade and board thickness. ↩
"Estimation of the Compressive Strength of Corrugated Board Boxes …", https://pmc.ncbi.nlm.nih.gov/articles/PMC8467740/. Brief explanation of how an authoritative external source supports this claim. Evidence role: technical validation; source type: industry standard. Supports: the relationship between flute density and load-bearing capacity to prevent crushing. Scope note: specific to corrugated board engineering. ↩
"A Complete Guide to Co-Packing Costs | ChemRite CoPac", https://chemritecopac.com/is-co-packing-right-for-your-business/. Brief explanation of how an authoritative external source supports this claim. Evidence role: empirical proof; source type: operational research. Supports: the claim that reduced assembly time directly lowers operational labor expenditures. Scope note: applicable to retail display assembly. ↩
"Online-to-Offline Attribution Gap: Why 84% of Ad Impact … – LiftLab", https://liftlab.com/blog/online-to-offline-attribution-gap/. Brief explanation of how industry research supports the claim that offline conversions are difficult to map to specific digital touchpoints without tracking. Evidence role: justification; source type: marketing research report. Supports: the existence of the 'attribution gap'in omnichannel retail. Scope note: focuses on the disconnect between physical and digital data. ↩
"Marketing attribution — models and best practices", https://business.adobe.com/blog/basics/marketing-attribution. Brief explanation of how a technical source describes the loss of precision in attribution models when physical touchpoint data is absent. Evidence role: technical validation; source type: data analytics guide. Supports: the inaccuracy of non-integrated attribution models. Scope note: applies specifically to multi-touch attribution (MTA). ↩
"Aqueous Coating Explained – Print Finish Guide – 4OVER4.com", https://www.4over4.com/guide/what-is-aqueous-coating?srsltid=AfmBOoppttFmamIm0bZOwBn2rfbroi6Uvvywkf1mBbzVmSc7Q5qnBi3z. Explains how high-gloss aqueous coatings cause specular reflection that hinders camera focus and image contrast for QR codes. Evidence role: Technical verification; source type: Printing industry technical guide. Supports: The claim that gloss coatings can render codes unreadable. Scope note: Effects depend on lighting intensity and angle. ↩
"Retail premises design for effective displays and customer flow", https://www.business.qld.gov.au/industries/manufacturing-retail/retail-wholesale/retail-displays. Validates the concept of the 'strike zone'as the optimal vertical range for consumer visibility and physical interaction in retail environments. Evidence role: Industry standard validation; source type: Visual merchandising manual. Supports: The efficacy of placing codes in the primary strike zone for maximum engagement. Scope note: Standard heights may vary slightly by consumer demographic. ↩
"What size should a QR code be? – Blinq", https://blinq.me/blog/what-size-should-a-qr-code-be. Technical documentation on the ratio between QR code size and the minimum distance from which a camera can successfully decode it. Evidence role: technical specification; source type: imaging standards manual. Supports: optimal QR code dimensions for a three-foot range. Scope note: results may vary based on camera resolution. ↩
"Barcode Labels: Gloss and Matte Finishes", https://free-barcode.com/barcode/new-technology-a/barcode-labels-gloss-matte-finishes.asp. Authoritative source explaining how matte finishes reduce specular reflection and improve QR code readability under bright overhead lighting. Evidence role: technical verification; source type: packaging industry guide. Supports: the claim that matte varnishes eliminate glare. Scope note: specific to high-glare retail environments. ↩
"Where should the QR code go on retail packaging? – GS1 UK", https://www.gs1uk.org/knowledge-hub/qr-codes-powered-by-gs1/where-should-the-qr-code-go-on-retail-packaging. Marketing and ergonomic research defining the 'strike zone'(eye-level or hand-level placement) to maximize consumer interaction. Evidence role: empirical evidence; source type: consumer behavior study. Supports: the claim that specific placement ensures frictionless access. Scope note: focus on retail shelf placement. ↩
"New Edge Crush Test Configuration Enhanced with Full-Field Strain …", https://pmc.ncbi.nlm.nih.gov/articles/PMC8510352/. Industry standards like ASTM define the Edge Crush Test (ECT) as a measure of raw material strength, which differs from the actual compressive strength of an assembled structure. Evidence role: technical definition; source type: industry standard. Supports: the claim that raw material certifications are insufficient for validating final product success. Scope note: focuses on corrugated materials. ↩
"Corrugated Box Design: What Makes Them So Strong?", https://www.jamestowncontainer.com/packaging-resources/blog/corrugated-box-design-what-makes-them-so-strong/. Technical documentation in packaging science explains how the conversion from a flat sheet to a three-dimensional structure changes the load-bearing and kinetic properties of paperboard. Evidence role: technical validation; source type: engineering manual. Supports: the necessity of evaluating assembled geometry over raw material strength. Scope note: specifically for corrugated retail displays. ↩
"[PDF] ISTA 3A – International Safe Transit Association", https://ista.org/docs/3Aoverview.pdf. Detailed standards from the International Safe Transit Association outlining the vibration and shock requirements for the 3A test. Evidence role: technical specification; source type: industry standard. Supports: The use of a specific simulation to identify structural failures. Scope note: Focuses on small parcel delivery simulations. ↩
"[PDF] Optimum Design of Corrugated Board under Buckling Constraints", https://www.ilsb.tuwien.ac.at/~daxner/WCSMO-7-Paper-A0306-Daxner.pdf. Engineering principles regarding structural tolerances in corrugated nesting to mitigate kinetic friction and optimize load distribution. Evidence role: design principle; source type: packaging engineering manual. Supports: The claim that precise geometric offsets prevent transit buckling. Scope note: Application may vary based on material ECT ratings. ↩
"optimizing safety and efficiency in packaging testing", https://www.safeloadtesting.com/en/transportation-simulator-optimizing-safety-and-efficiency-in-packaging-testing/. Technical explanation of how simulated vibration and shock testing (dynamic simulations) verify packaging durability against shipping stresses. Evidence role: technical validation; source type: engineering standard. Supports: survival during rough shipping. Scope note: applies to kinetic supply chain testing. ↩
"[PDF] Transportation Vibration Effects on Unitized Corrugated Containers", https://www.fpl.fs.usda.gov/documnts/fplrp/fplrp322.pdf. Mechanical engineering analysis of how specific geometric tolerances prevent stress concentration and tearing during multi-axis vibration. Evidence role: engineering principle; source type: mechanical engineering manual. Supports: elimination of structural tearing under load. Scope note: focused on rigid material interfaces. ↩
"What Contract Packaging Mistakes Trigger Retailer Chargebacks?", https://www.industrialpackaging.com/blog/copacker-mistakes-retailer-chargebacks. Documentation of retail logistics compliance policies that impose financial penalties (chargebacks) for shipments with damaged master cartons. Evidence role: economic impact; source type: supply chain logistics guide. Supports: the financial risk of untested nested packaging. Scope note: subject to individual retailer agreements. ↩