تتكبد العلامات التجارية خسائر مستمرة في هوامش الربح في قطاع التجزئة بسبب الخلط بين مسؤولي عرض المنتجات في الممرات وموظفي نقاط البيع. وعندما تتجاهل هياكل متاجركم تقسيمات مناطق البيع بالتجزئة، يقوم مديرو المتاجر بإتلافها مباشرةً.
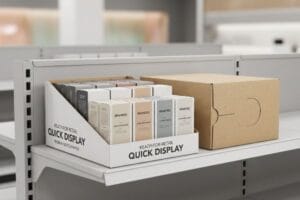
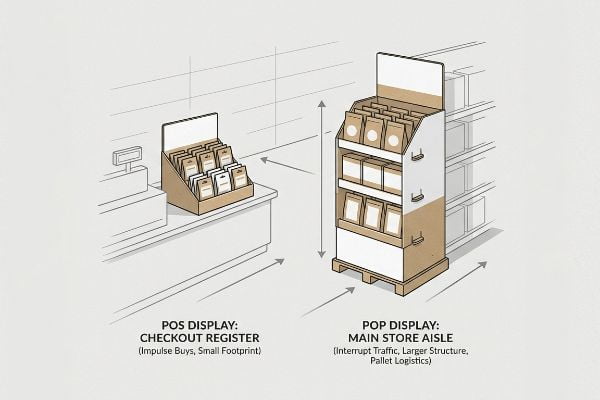
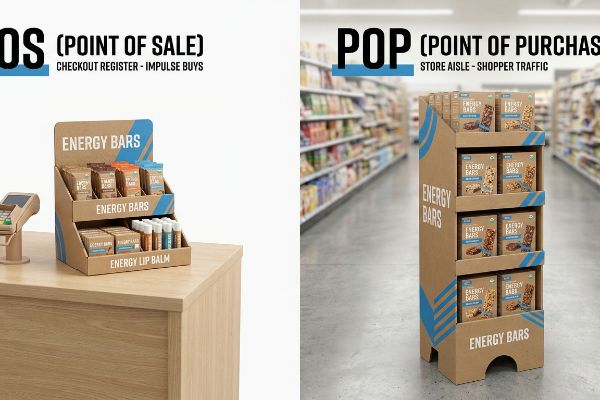
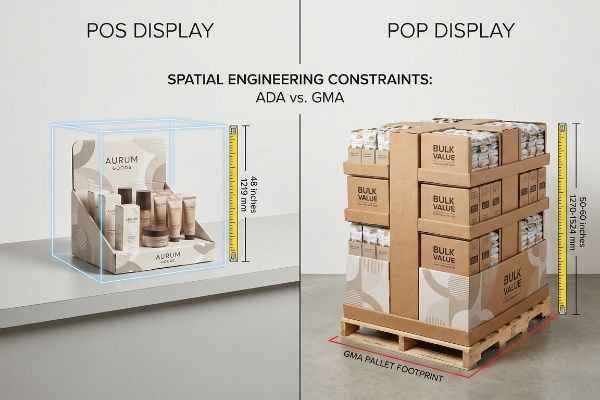
تُوضع شاشة عرض نقاط البيع مباشرةً عند صندوق الدفع لتحفيز عمليات الشراء الفورية، بينما تشغل شاشة عرض نقاط البيع الممرات الرئيسية للمتجر لجذب انتباه المتسوقين. ويضمن التمييز بين هذين النوعين من الشاشات أن تراعي عبوات منتجاتك قيود مساحة صناديق الدفع ومتطلبات لوجستيات نقل البضائع الثقيلة عبر الممرات.
إن فهم هذا التمييز ليس مجرد تمرين تسويقي؛ بل إنه يحدد بدقة درجات اللوحة المادية وهندسة البصمة المطلوبة للبقاء على قيد الحياة في طرح البيع بالتجزئة في المتاجر الكبيرة.
ما الفرق بين نظام نقاط البيع (POS) وشاشة العرض الترويجية (POP)؟
إن فصل هاتين المنطقتين التجاريتين يتطلب أكثر من مجرد تصغير حجم الأعمال الفنية. بل يتطلب تحولاً هيكلياً كاملاً قائماً على حدود مادية مميزة للمتاجر.
يكمن الفرق بين شاشات نقاط البيع وشاشات نقاط البيع في حدودها الهندسية المكانية. يجب أن تلتزم وحدات نقاط البيع بمناطق وصول محددة بدقة، بينما صُممت وحدات نقاط البيع لتحمل ضغطًا هائلاً من الأعلى على منصات التحميل اللوجستية القياسية.
عندما تطمس العلامات التجارية هذه الخطوط، فإنها تتسبب في رفض من قبل مديري المتاجر الكبرى للامتثال للوائح.
إطار القيود المكانية لقانون الأمريكيين ذوي الإعاقة مقابل قانون إدارة المناطق الحضرية
تُوضع وحدة نقاط البيع (POS) على سطح طاولة، ما يعني أن أبعادها تخضع بشكل دائم لقانون الأمريكيين ذوي الإعاقة (ADA) فيما يتعلق بمدى الوصول الأمامي، والذي يتراوح بين 15 و48 بوصة381 و1219 مم). في المقابل، تُوضع وحدة عرض المنتجات (POP) على الأرض. ويجب أن تتوافق بنيتها الفيزيائية تمامًا مع مساحة منصة التحميل المحددة من قبل جمعية مصنعي البقالة (GMA) والبالغة 48×40 بوصة (1219×1016 مم)بنسبة50% لتناسب منطقة نقاط البيع، فإنك بذلك تُخالف الحدود الرياضية لكلا البيئتين.
أفصل بشكل دائم مسارات التصميم الهندسي لهذين النوعين من شاشات العرض نظرًا لاختلاف توزيع الأحمال بينهما اختلافًا جذريًا. تعتمد وحدة عرض نقاط البيع الأرضية على محاذاة التمويجات الرأسية واختبار ضغط الصناديق (BCT) في الزوايا (المستوى 3 ) لتحمل الشحن البحري المزدوج. أما وحدة عرض نقاط البيع على المنضدة، فتعتمد على احتكاك القاعدة ونسبة دقيقة بين العمق والارتفاع (المستوى 4) لمنع انقلابها عند تناول المستهلكين للمنتجات. من خلال التعامل معهما كنظامين ميكانيكيين منفصلين، أضمن تطابق الحسابات الهيكلية تمامًا مع الواقع المادي لمنطقة البيع بالتجزئة المستهدفة، مما يحمي العلامة التجارية من ثغرات الامتثال المكلفة.
| مقياس القيد | وحدة نقاط البيع | وحدة نقاط البيع |
|---|---|---|
| المرساة المكانية | نافذة الوصول إلى سطح الطاولة | منصة نقالة قياسية من GMA5 |
| الحد الأقصى للطول | الحد الأقصى 48 بوصة (1219 مم)6 | 50-60 بوصة (1270-1524 مم)7 |
| الحمل الديناميكي | منتجات النبض الضوئي | مخزون ضخم من المواد السائبة |
أصمم كل عرضٍ بناءً على سؤالي الأول: أين سيُوضع؟ إذا صممتَ دون تحديد القيود المادية الدقيقة لمنطقة البيع بالتجزئة المحددة، فأنتَ تُنشئ مجرد منتجاتٍ عديمة الفائدة ومكلفة.
🛠️ مكتب هارفي: هل تُؤثر صواني الدفع الثقيلة سلبًا على عائد استثمار الشحن قبل وصولها إلى المتجر؟ 👉 احصل على تدقيق مجاني للقيود المكانية ↗ — أقوم بمراجعة كل ملف هيكلي شخصيًا خلال 24 ساعة.
هل تعني كلمة POP نقطة الشراء؟
يُستخدم الاختصار على نطاق واسع، ولكن غالبًا ما يُساء فهم التطبيق المادي من قبل وكالات التصميم الجرافيكي التي تتعامل مع الممر كما لو كان شاشة كمبيوتر ثابتة.
نعم. يشير اختصار POP إلى نقطة البيع، وهو أي عنصر ترويجي يُوضع بشكل استراتيجي في الممرات الرئيسية للمتجر. صُممت هذه العناصر خصيصًا لجذب انتباه المتسوقين، باستخدام أشكال كبيرة مقطوعة بدقة وألوان زاهية لتحفيز عمليات الشراء غير المخطط لها.
إن الاعتراف بهذا التعريف أمر سهل، لكن هندسة لوح مموج لتنفيذ عملية اعتراض الممر بنجاح تتطلب حسابات مكانية مكثفة.
واقع التفاعل المكاني 3-3-3
حتى فرق المشتريات ذات الخبرة غالبًا ما توافق على ملفات نقاط البيع بناءً على نسخ رقمية بصيغة PDF فقط، متجاهلةً تمامًا كيفية تنقل المتسوقين في مساحات البيع بالتجزئة الشاسعة. يفترضون أن النصوص التسويقية الكثيفة والمطولة ستجذب الزوار،متناسين أن المستهلكين يتحركون بسرعة باستخدام عربات التسوق. عند مراجعتي لهذه التصاميم المسطحة، ألاحظ باستمرار ثغرات هيكلية حيث تضيع رسالة العلامة التجارية الأساسية تمامًا وسط الضوضاء البصرية للمتجر المضاء بمصابيحالفلورسنت.
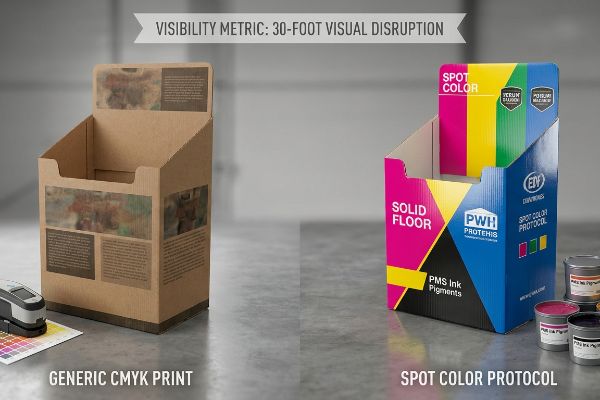
في منشأتي، أرى باستمرار عملاء يحاولون طباعة نصوص ضخمة باستخدام ألوان CMYK القياسية (سماوي، أرجواني، أصفر، أبيض) على ورق مقوى مموج غير مُغلق. عند قياس امتصاص الحبر في المصنع باستخدام مطياف ضوئي تحت إضاءة D50 قوية، تتسبب الألياف المسامية في زيادة كثافة النقاط بنسبة 14.3% ، مما يحول الرسومات إلى بقع ضبابية غير قابلة للقراءة من مسافة بعيدة. لحل هذه المشكلة، أعتمد بروتوكولًا يعتمد على لون موضعي قوي، حيث أستبدل مزج النقاط الضوئي بصبغة PMS (نظام مطابقة ألوان بانتون) ممزوجة بكثافة. يضمن هذا التحسين في التركيب الكيميائي الفيزيائي سطحًا صلبًا عاكسًا للضوء يصل إلى عتبة التشويش البصري من مسافة 30 قدمًا . من خلال تطبيق هذا التحول في المواد عالية التباين، أضمن أن تجذب الشاشة انتباه المتسوقين فورًا، مما يمنعها من الاندماج مع الخلفية ويوفر على العملاء آلاف الدولارات في حملات البيع بالتجزئة المهملة.
| مقياس الرؤية | طباعة CMYK عامة | بروتوكول لون البقعة |
|---|---|---|
| خطاف بطول 30 قدمًا | مغسول، موحل | اضطراب عالي التباين12 |
| مشاركة بطول 3 أقدام | نص كثيف للغاية | حجب العلامة التجارية بشكل نظيف |
| تحويل 3 بوصات | محجوبة بالشفة | تعرض المنتج بنسبة 85%13 |
أرفض السماح لتركيبة الحبر الرديئة بإفساد تصميم هيكلي رائع. إذا لم يتمكن مُرَوِّج المنتجات في ممرات متجرك من اختراق الفوضى البصرية من مسافة ثلاثين قدمًا، فقد فشل بالفعل.
🛠️ مكتب هارفي: هل تصميم عرض منتجاتك الحالي مُعرّض للسقوط بسبب احتكاكات الاستخدام اليومي في المتاجر؟ 👉 احصل على تحليل مجاني لخط الرؤية ↗ — سري تمامًا. تصاميمك غير المنشورة في المتاجر في أمان تام معي.
من يقوم عادةً بتوفير شاشات العرض الترويجية؟
غالباً ما تقوم العلامات التجارية بالاستعانة بمصادر خارجية لهذه الهياكل من قبل وكالات تصميم جرافيكي متخصصة، مع إعطاء الأولوية للجوانب الجمالية على حساب الحقائق القاسية للتصنيع المادي وبقاء سلسلة التوريد.
عادةً ما توفر شركات تصنيع التغليف المتخصصة وشركات الهندسة الإنشائية شاشات العرض في نقاط البيع. وعلى عكس وكالات التصميم الجرافيكي التي تنتج أعمالاً فنية ثنائية الأبعاد، تستخدم هذه الشركات المصنعة برامج التصميم بمساعدة الحاسوب (CAD) لحساب بدلات الانحناء الدقيقة، وسماكة الألواح، وتوزيع الأحمال الحركية للإنتاج الفعلي.
إن الاعتماد على سلسلة توريد مجزأة حيث تقوم وكالة تصميم ببساطة بتسليم أعمال فنية غير معايرة إلى طابعة عامة هو وصفة مضمونة لحدوث كوارث توقف خط الإنتاج.
فخ تعويض الفرجار في سلاسل التوريد المجزأة
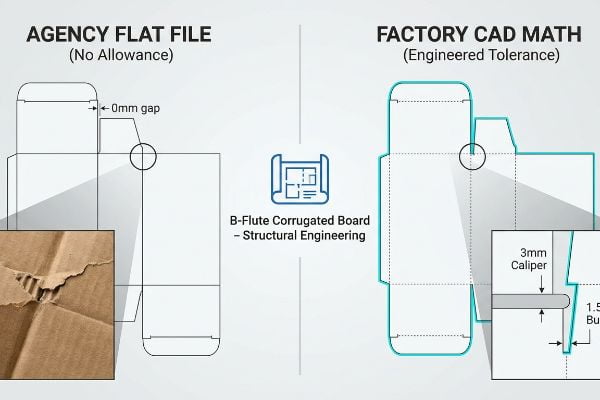
عندما تستعين العلامات التجارية بوكالات خارجية لتصميم هياكل نقاط البيع، يقوم هؤلاء المصممون برسم ألسنة متشابكة وفتحات قابلة للطي في برنامج Illustrator بنفس عرض اللوحة المقابلة تمامًا. ويتجاهلون تمامًا السماكة الفعلية للكرتون المموج. فعند طي لوحة من نوع B-flute بسماكة 3 مم (0.11 بوصة) بزاوية 90 درجة، فإنها تستهلك جزءًا من المادة، وإذا لم يتم تعديل ملف التصميم رياضيًا للتعويض عن ذلك، فسوف تنحني الشاشة بشدة أو تنكسر .
هذا ليس مجرد كلام نظري، فقد تعلمت هذا الدرس بطريقة قاسية العام الماضي أثناء معالجة ملف جاهز من وكالة متخصصة تابعة لأحد العملاء. في عام ٢٠٢٣، طلبت من كبير مهندسي التغليف، مارك، تشغيل دفعة تجريبية بيضاء مكونة من ٥٠ وحدة على طاولة القطع من كونغسبيرغ باستخدام رسوماتهم المتجهة التي يفترض أنها جاهزة للطباعة. أتذكر جيدًا مشاهدتي لمارك وهو يحاول تجميع القاعدة؛ سمعت صوت طقطقة مزعجة لورق الكرافت الخام وهو يمزقه بينما كان يُدخل ألسنة التثبيت غير المُعالجة بسمك ٣.١٧ مم في فتحات صلبة. لقد تعاملت الوكالة مع الكرتون المموج السميك كما لو كان ورق طباعة رقيق. اضطررنا إلى إيقاف قائمة ما قبل الطباعة فورًا، وإعادة حساب خوارزميات سماحية الانحناء١٦ في برنامجنا، وتوسيع كل فتحة استقبال فعليًا بمقدار ١.٥ مم بالضبط لإنشاء حاجز رطوبة١٧.أنا أهدر الوقت والمال في مختبر الاختبار الخاص بي حتى لا تخسروا أنتم أرباحكم في متاجر البيع بالتجزئة. لم يمنع هذا التعديل الديناميكي للتفاوتات القاعدة من الانفصال فحسب؛ وقد قلل ذلك من وقت تجميع التعبئة المشتركة بمقدار 45 ثانية لكل وحدة، مما وفر على العميل 4100 دولار من رسوم العمالة اليدوية.
| المتغيرات الهندسية | ملف وكالة مسطح | الرياضيات في تصميم المصانع |
|---|---|---|
| فرجار لوح الخشب | تمت معاملتها على أنها 0 مم18 | تم حسابها عند 3 مم |
| تفاوت الفتحة | تطابق تام بنسبة 1:1 | مخزن مؤقت ديناميكي 1.5 مم19 |
| نتيجة التجميع | التمزيق والانحناء20 | قفل بدون احتكاك |
أرى كل أسبوع رسومات رائعة تُهدر بسبب حسابات هيكلية غير متقنة. أنت بحاجة إلى شريك تصنيع موحد يتولى هندسة اللوحة المادية قبل البدء في تصميم العمل الفني.
🛠️ مكتب هارفي: هل تخفي قوالب القطع الخارجية لديكم أخطاءً دقيقة في الفتحات ستضاعف تكاليف عمالة التعبئة والتغليف؟ 👉 اطلبوا تدقيقًا مجانيًا لتفاوتات قوالب القطع ↗ — بدون وسطاء. تتحدثون مباشرةً مع مهندسين إنشائيين.
ما هي الأنواع الثلاثة لنقاط البيع؟
يُتيح لك تصنيف تجهيزات نقاط البيع بشكل صحيح نشر البصمة الهيكلية الدقيقة اللازمة لزيادة التحويلات الاندفاعية إلى أقصى حد عند نقطة الدفع.
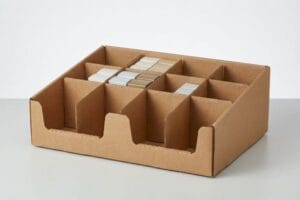
تتضمن الأنواع الرئيسية الثلاثة لشاشات نقاط البيع وحدات سطح الطاولة، ووحدات العرض الأرضية القائمة بذاتها، ووحدات العرض الجانبية المعلقة. يستهدف كل نوع منها منطقة مكانية محددة بالقرب من صندوق الدفع لجذب المستهلكين، وذلك باستخدام وضع المنتجات في مواقع محددة بدقة لتحفيز قرارات الشراء الفورية في اللحظات الأخيرة.
بينما تتميز النماذج المعلقة والأرضية بقيودها الفريدة، فإن وحدة سطح الطاولة هي المكان الذي أرى فيه أكثر حالات الفشل الفيزيائي كارثية.
نسبة ثبات سطح العمل من حيث العمق إلى الارتفاع 2:3
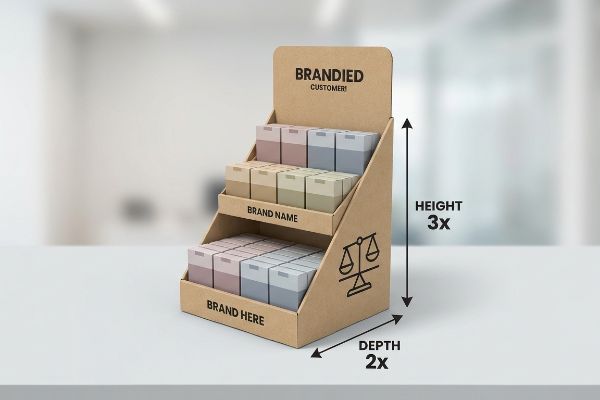
تُفضل العلامات التجارية طلب منصات عرض ضخمة على أسطح الطاولات لعرض أكبر قدر من المنتجات، ظنًا منها أن الارتفاع يُحسّن الرؤية. لكنها تتجاهل تمامًا مركز الثقل. فعندما يسحب المستهلك منتجًا بقوة من الرف العلوي لمنصة عرض ضيقة وثقيلة من الأعلى، تتغلب قوة الاحتكاك الحركي فورًا على وزن القاعدة،مما يؤدي إلى سقوط المنصة بالكامل على جهاز الدفع.
في منشأتي، أرى باستمرار فرق المشتريات تُقدّم طلبات عروض أسعار تُصمّم شاشات العرض على أسطح الطاولات بارتفاع شاهق يصل إلى 609 ملم، بينما تُقيّد عمق القاعدة إلى 203 ملم فقط لتوفير تكاليف المواد. عندما أُطبّق هذه النسب نفسها على اختبارات طاولة الإمالة، تكون النتائج كارثية: مجرد تغيير بسيط في زاوية الميل بمقدار 12 درجة يُؤدي إلى زعزعة استقرار الحمولة البالغة 8.3 كجم تمامًا وسقوطها. بعد أن سمح لي فريق المشتريات بتعديل التصميم الهيكلي، فرضتُ نسبة دقيقة بين العمق والارتفاع تبلغ 2:3،مع تمديد الحامل إلى عمق 406 ملم، وإضافة نقش داخلي على صينية القاعدة لزيادة الاحتكاك السفلي. حلّت هذه الهندسة الدقيقة مشكلة الثبات دون الحاجة إلى إضافة كتل وزن بلاستيكية باهظة الثمن. من خلال تطبيق هذه الهندسة المحسوبة، تمكنت من القضاء تمامًا على خطر الانقلاب، ومنع خسارة تقدر بنحو 15٪ من المخزون بسبب تلفيات البيع بالتجزئة، وإزالة مخاطر المسؤولية عن العلامة التجارية تمامًا عند ممر الدفع.
| مقياس الاستقرار | تصميم ثقيل من الأعلى | نسبة هندسية 2:323 |
|---|---|---|
| مركز الثقل | مرتفع بشكل خطير | مثبتة في القاعدة |
| تحمل الميل | يفشل عند 12 درجة24 | مستقر بعد 25 درجة25 |
| قاعدة المواد | بصمة ضيقة | حامل خلفي ممتد |
لا يهمني مدى رخص تكلفة تصنيع شاشة العرض الضيقة. إذا انقلبت عند لمسها من قبل أحد المتسوقين، فهي تشكل خطراً وليست وسيلة لعرض البضائع.
🛠️ مكتب هارفي: هل وحدة الدفع الطويلة لديك تتأرجح كالبندول على وشك إسقاط منتجاتك على الأرض؟ 👉 احصل على حساب نسبة 2:3 مجانًا ↗ — أراجع كل ملف هيكلي شخصيًا خلال 24 ساعة.
خاتمة
إن تجاهل حسابات الفيزياء المكانية واللوجستية التي تفصل بين رفوف العرض في الممرات وصناديق الدفع سيؤدي حتماً إلى تكدس المنتجات في الأعلى، مما سيؤثر سلباً على هوامش ربحك. في الشهر الماضي وحده، ساعدت مراجعتي الهيكلية ثلاث علامات تجارية على تجنب خسائر تزيد عن 10,000 دولار أمريكي في المخزون التالف ورسوم استرداد الأموال من تجار التجزئة. إذا كنت ترغب في ضمان سلامة هياكلك، سواءً من حيث النقل أو القياس، دعني أراجع ملفاتك الهيكلية شخصياً من خلال مراجعة الامتثال المكاني المجانية لتجارة التجزئة ↗ اليوم.
الفصل الثالث: الأجزاء القابلة للتشغيل - Access-Board.gov، https://www.access-board.gov/ada/guides/chapter-3-operable-parts/. تأكيد متطلبات الارتفاع الخاصة بقانون الأمريكيين ذوي الإعاقة (ADA) للوصول الأمامي للتحقق من حدود إمكانية الوصول إلى نقاط البيع. دور الدليل: التحقق الفني؛ نوع المصدر: لائحة حكومية. يدعم: القيود المكانية لقانون الأمريكيين ذوي الإعاقة (ADA). ملاحظة النطاق: ينطبق على نطاقات الوصول المتاحة. ↩
"منصة خشبية معالجة حرارياً من نوع GMA - 48 × 40 بوصة H-1260 - ULINE"، https://www.uline.com/Product/Detail/H-1260/Pallets/Heat-Treated-Wood-GMA-Pallet-48-x-40. التحقق من أبعاد المنصة القياسية المعتمدة من قبل جمعية مصنعي البقالة للشحن بالتجزئة. دور الدليل: المواصفات الفنية؛ نوع المصدر: معيار صناعي. يدعم: متطلبات مساحة نقاط البيع. ملاحظة النطاق: معيار أمريكا الشمالية. ↩
"تقدير قوة الضغط لصناديق الكرتون المموج..."، https://pmc.ncbi.nlm.nih.gov/articles/PMC8467740/. التحقق الفني من كيفية ضمان اتجاه التموجات ومعايير BCT للسلامة الهيكلية للشحنات المعبأة على منصات نقالة. دور الدليل: التحقق الفني؛ نوع المصدر: معيار هندسة التغليف. يدعم: المتطلبات الهيكلية لوحدات أرضيات نقاط البيع. ملاحظة النطاق: ينطبق تحديدًا على هياكل الكرتون المموج. ↩
[PDF] Tipover-Prevention-Project-Anchors-without-Tools.pdf – CPSC، https://www.cpsc.gov/s3fs-public/pdfs/Tipover-Prevention-Project-Anchors-without-Tools.pdf. التحقق من مبادئ الثبات الميكانيكي المستخدمة لمنع الانقلاب في تجهيزات البيع بالتجزئة خفيفة الوزن. دور الدليل: التحقق الميكانيكي؛ نوع المصدر: إرشادات التصميم الصناعي. يدعم: هندسة الثبات لوحدات نقاط البيع. ملاحظة النطاق: يركز على حسابات مركز الثقل لشاشات العرض على الطاولات. ↩
"أنواع عرض المنصات: كاملة، نصف، وربع - GreenDot Packaging"، https://greendotpackaging.com/understanding-pallet-display-types-full-half-and-quarter-pallet-displays/. تأكيد على أن منصة جمعية مصنعي البقالة (GMA) هي الأساس الهيكلي لبصمات عرض نقاط البيع. دور الدليل: معيار صناعي؛ نوع المصدر: مواصفات لوجستية. يدعم: التثبيت المكاني لنقاط البيع. ملاحظة النطاق: موحد لتجارة التجزئة في أمريكا الشمالية. ↩
معايير قانون الأمريكيين ذوي الإعاقة للتصميم المُيسّر، الباب الثالث، اللائحة 28 CFR...، https://www.ada.gov/law-and-regs/design-standards/1991-design-standards/. التحقق من الحد الأقصى للارتفاع القياسي في الصناعة لشاشات نقاط البيع على أسطح الطاولات، وذلك وفقًا لإرشادات بيئة العمل وإمكانية الوصول. دور الدليل: المواصفات الفنية؛ نوع المصدر: معيار إمكانية الوصول. يدعم: قيود ارتفاع نقاط البيع. ملاحظة النطاق: خاص بوحدات أسطح الطاولات. ↩
"أحجام المنصات القياسية - 48×40 GMA و6 أبعاد شائعة أخرى"، https://www.wearewarp.com/standard-pallet-sizes. التحقق من نطاق الارتفاع القياسي لعروض نقاط البيع الأرضية (POP) بناءً على تخطيط مساحة البيع بالتجزئة. دور الدليل: المواصفات الفنية؛ نوع المصدر: دليل تصميم متاجر التجزئة. يدعم: قيود ارتفاع نقاط البيع. ملاحظة النطاق: خاص بوحدات العرض الأرضية القائمة بذاتها. ↩
"تقييم انتباه المستهلك وإثارته باستخدام تتبع حركة العين..."، https://pmc.ncbi.nlm.nih.gov/articles/PMC8380820/. تشير أبحاث علم نفس المستهلك إلى أن المتسوقين أثناء حركتهم يتجاهلون النصوص الكثيفة لصالح الإشارات البصرية عالية التباين. دور الدليل: دليل مضاد لافتراضات الصناعة؛ نوع المصدر: دراسة سلوك المستهلك. يدعم: عدم كفاءة شاشات نقاط البيع المليئة بالنصوص. ملاحظة النطاق: ينطبق على مناطق الشراء الاندفاعي. ↩
"دور الإضاءة في نجاح تجارة التجزئة | CLI"، https://www.commercial-lighting.net/the-role-of-lighting-in-retail-success/. تشرح دراسات علم النفس البيئي كيف تُؤدي الإضاءة المحيطة عالية الكثافة والتشويش البصري إلى تداخل معرفي وتدهور القدرة على تمييز النقاط المحورية. دور الدليل: التحقق التقني؛ نوع المصدر: دراسة في علم النفس البيئي. يدعم: وجود نقاط عمياء هيكلية في تجارة التجزئة. ملاحظة النطاق: خاصة ببيئات متاجر التجزئة الكبيرة. ↩
[PDF] 1. زيادة حجم النقاط هي زيادة في أحجام نقاط الطباعة النصفية نتيجة امتصاص الحبر في...، https://www.coloradomesa.edu/art/documents/student-resources/study-guide-2019.pdf. التحقق الفني من النسبة المئوية المحددة لزيادة حجم النقاط المرتبطة بالركائز المموجة غير المغلقة لإثبات تدهور الصورة. دور الدليل: تحديد الفشل الفني كميًا؛ نوع المصدر: دليل فني لصناعة الطباعة. يدعم: تأثير مسامية المادة على جودة الطباعة. ملاحظة النطاق: يقتصر على مواد الطباعة التجريبية غير المغلقة. ↩
"تصميم متاجر التجزئة لعرض المنتجات بشكل فعّال وتسهيل حركة العملاء"، https://www.business.qld.gov.au/industries/manufacturing-retail/retail-wholesale/retail-displays. معيار صناعي للمسافة التي يجب أن يجذب عندها عرض نقطة البيع انتباه المتسوق بشكل فعّال. دور الدليل: وضع معيار للأداء؛ نوع المصدر: أبحاث التسويق البصري. يدعم: ضرورة استخدام ألوان موضعية عالية التباين. ملاحظة النطاق: ينطبق على ممرات المتاجر الرئيسية. ↩
"مقارنة بين نظام CMYK والألوان الموضعية في طباعة التغليف"، https://meyers.com/meyers-blog/cmyk-vs-spot-colors-in-packaging-printing-what-cpg-brands-need-to-know/. تحليل فني لتشبع اللون وتباين الإضاءة بين الألوان الموضعية وطباعة CMYK من حيث وضوح الرؤية عن بُعد. دور الدليل: تبرير فني؛ نوع المصدر: علم الألوان أو معيار صناعة الطباعة. يدعم: التشويش البصري على بُعد 30 قدمًا. ملاحظة النطاق: يركز على شدة اللون. ↩
"إضاءة LED في عروض البيع بالتجزئة - ملخص للمزايا والاعتبارات"، https://www.bishopfixtures.com/create-stunning-retail-displays-with-led-lighting/. بيانات مرجعية صناعية تقيس المساحة المرئية الفعالة للمنتجات في عروض نقاط البيع باستخدام بروتوكولات ألوان عالية التشبع. دور الدليل: التحقق الكمي؛ نوع المصدر: ورقة عمل تصميم متاجر التجزئة. يدعم: مقياس عرض المنتج. ملاحظة النطاق: خاص بمنطقة التحويل 3 بوصات. ↩
"الكرتون المموج ودرجات المواد - استراتيجيات التغليف"، https://www.packagingstrategies.com/articles/96269-corrugated-board-and-material-grades. تُؤكد مواصفات المواد القياسية في الصناعة السُمك الاسمي للكرتون المموج من النوع B. دور الدليل: التحقق الفني؛ نوع المصدر: معيار التصنيع؛ يدعم: قياس دقيق للمواد. ملاحظة: قد يختلف السُمك قليلاً باختلاف المُصنِّع. ↩
"التحليل التحليلي لتحديد صلابة الانحناء لخمس طبقات..."، https://pmc.ncbi.nlm.nih.gov/articles/PMC8777652/. تشرح أدلة الهندسة الإنشائية للتغليف كيف يؤدي إهمال بدل الانحناء وسماكة المادة إلى إجهاد ميكانيكي وانهيار هيكلي. دور الدليل: مبدأ تقني؛ نوع المصدر: دليل هندسي؛ يدعم: العواقب المادية للملفات الهيكلية غير الصحيحة. ملاحظة النطاق: تعتمد شدة الانهيار على درجة الورق المقوى. ↩
"حاسبة مجانية لبدلات ثني الصفائح المعدنية | فيرجيلي للهندسة"، https://www.firgelliauto.com/blogs/engineering-calculators/sheet-metal-bend-allowance-calculator?srsltid=AfmBOopo5N2WMUwZDv3esoWnldMKcOT321czAboMMFD9JSqoGYrpDCDK. شرح موجز لكيفية حساب برامج التصميم بمساعدة الحاسوب (CAD) لبدلات الثني بناءً على سُمك المادة (الفرجار) لضمان دقة الطي. دور الدليل: التحقق الفني؛ نوع المصدر: دليل هندسي. يدعم: ضرورة وجود برامج متخصصة لشاشات نقاط البيع الجاهزة للإنتاج. ملاحظة النطاق: ينطبق على المواد المموجة الصلبة. ↩
"تأثير الرطوبة ودرجة الحرارة على الخواص الميكانيكية لـ..."، https://bioresources.cnr.ncsu.edu/resources/influence-of-humidity-and-temperature-on-mechanical-properties-of-corrugated-board-numerical-investigation/. شرح موجز لكيفية تأثير محتوى الرطوبة في الورق المقوى على ثبات الأبعاد، مما يستلزم وجود هوامش سماح في تصميم الفتحات لمنع التمزق. دور الدليل: التحقق التقني؛ نوع المصدر: كتاب مدرسي في علم المواد. يدعم: الادعاء بأن الفتحات المادية يجب أن تكون أعرض من الجزء المقابل لها لمراعاة العوامل البيئية. ملاحظة النطاق: خاص بالورق المقوى الخام والورق المقوى المعاد تدويره. ↩
"خطأ السماكة الصفرية في برنامج SOLIDWORKS: ما معناه؟"، https://www.goengineer.com/blog/solidworks-zero-thickness-error. التحقق الفني من ظاهرة شائعة في الصناعة، حيث تتجاهل ملفات التصميم ثنائية الأبعاد سماكة المادة (الفرجار)، مما يؤدي إلى فشل هيكلي. دور الدليل: التحقق الفني؛ نوع المصدر: دليل هندسة التغليف. يدعم: عدم دقة الملفات المسطحة التي تُصدرها الجهات المختصة. ملاحظة النطاق: خاص بتحويل ثنائي الأبعاد إلى ثلاثي الأبعاد في شاشات العرض المموجة. ↩
[2009.11741] تحديد حجم المخزن المؤقت الديناميكي لحدث خارج الترتيب... – arXiv، https://arxiv.org/abs/2009.11741. التحقق من التفاوتات الهندسية القياسية لتجميعات الفتحات واللسان في شاشات نقاط البيع لضمان الملاءمة الصحيحة. دور الدليل: التحقق من المواصفات؛ نوع المصدر: معيار التصنيع. يدعم: ضرورة إجراء تعديلات على مستوى المصنع باستخدام برامج التصميم بمساعدة الحاسوب (CAD). ملاحظة النطاق: قد تختلف التفاوتات بناءً على سُمك المادة. ↩
[ملف PDF] التجعيد والطي - BioResources، https://bioresources.cnr.ncsu.edu/wp-content/uploads/2019/01/2017.1.69.pdf. توثيق لأنماط الفشل المادي في تجميعات الكرتون الصلب عندما لا يُؤخذ سُمك المادة في الاعتبار عند التصميم. دور الدليل: التحقق من السبب والنتيجة؛ نوع المصدر: دراسة حالة في الهندسة الإنشائية. يدعم: نتائج تجميع تصميم سلسلة التوريد المجزأة. ملاحظة النطاق: ينطبق على مواد الكرتون عالية السماكة. ↩
"PLTW IED 5.7 – أمثلة على قوة الانقلاب – يوتيوب"، https://www.youtube.com/watch?v=XbXJa6Yv9pQ. مصدر في الفيزياء أو الهندسة الإنشائية يشرح كيفية تأثير القوة المطبقة والاحتكاك على نقطة انقلاب الأجسام ذات الوزن العلوي الثقيل بالنسبة لوزن قاعدتها. دور الدليل: التحقق التقني؛ نوع المصدر: كتاب فيزياء أو دليل تصميم صناعي. يدعم: الآلية الفيزيائية المسببة لعدم استقرار الشاشة. ملاحظة النطاق: ينطبق على تجهيزات أسطح العمل ذات القاعدة الضيقة. ↩
"هل يُمكنني بناء رفوف أطول؟ أهمية نسبة الارتفاع إلى العمق..."، https://www.americansurplus.com/can-i-build-taller-racking-the-importance-of-height-to-depth-ratio-to-rack-stability/?srsltid=AfmBOorcSp2VrfKjFrg67taboepJKZrTuQhFZe3iYN4_9SntPDtvpUE0. تُؤكد الإرشادات الهندسية الفنية لتجهيزات متاجر التجزئة النسبة المثلى لعمق القاعدة إلى ارتفاعها، وهي النسبة المطلوبة للحفاظ على الثبات ومنع الانقلاب تحت الحمل. دور الدليل: التحقق الفني؛ نوع المصدر: معيار صناعي/دليل هندسي. يدعم: فعالية نسبة 2:3 لثبات أسطح العمل. ملاحظة: قد يختلف الثبات المُحدد بناءً على مركز ثقل الحمولة. ↩
"كيف تدعم نسبة الارتفاع إلى العمق استقرار رفوف التخزين - RMI"، https://www.rmiracksafety.org/2021/05/20/how-height-to-depth-ratio-contributes-to-overall-storage-rack-stability/. معيار صناعي لنسبة العمق إلى الارتفاع المطلوبة لضمان استقرار عروض البيع بالتجزئة على أسطح الطاولات. دور الدليل: معيار صناعي؛ نوع المصدر: دليل تصميم تجهيزات البيع بالتجزئة. يدعم: تعريف نسبة الاستقرار الأمثل. ملاحظة النطاق: ينطبق تحديدًا على عروض أسطح الطاولات ذات الحامل الخلفي. ↩
[PDF] دليل المعهد الوطني للمعايير والتكنولوجيا رقم 44: المواصفات، والتفاوتات، وغيرها من الجوانب الفنية...، https://www.nist.gov/system/files/documents/2022/11/30/2023%20NIST%20Handbook%2044.pdf. التحقق الفني من الزاوية المحددة التي تفقد عندها تجهيزات نقاط البيع غير المتوازنة استقرارها عادةً. دور الدليل: مقياس الأداء؛ نوع المصدر: تقرير هندسة إنشائية. يدعم: عتبة فشل الميل للتصاميم غير المستقرة. ملاحظة النطاق: يتعلق بتجهيزات أسطح العمل غير المصممة هندسيًا. ↩
[ملف PDF] اللائحة 61-25 الخاصة بمؤسسات بيع المواد الغذائية بالتجزئة، https://agriculture.sc.gov/wp-content/uploads/2024/05/Regulation61-25_RetailFoodEstablishments_2024_digital.pdf. التحقق من صحة هامش تحمل الميل الذي توفره نسبة العمق إلى الارتفاع 2:3 في تجهيزات نقاط البيع. دور الدليل: المواصفات الفنية؛ نوع المصدر: اختبار ثبات المنتج. يدعم: عتبة الثبات للنسب الهندسية. ملاحظة النطاق: بناءً على حسابات مركز الثقل القياسية. ↩