
Retail traffic feels like a wave. When my aisles seem quiet, stale displays sit unchanged for weeks and the silence hurts sales. I must fix that fast.
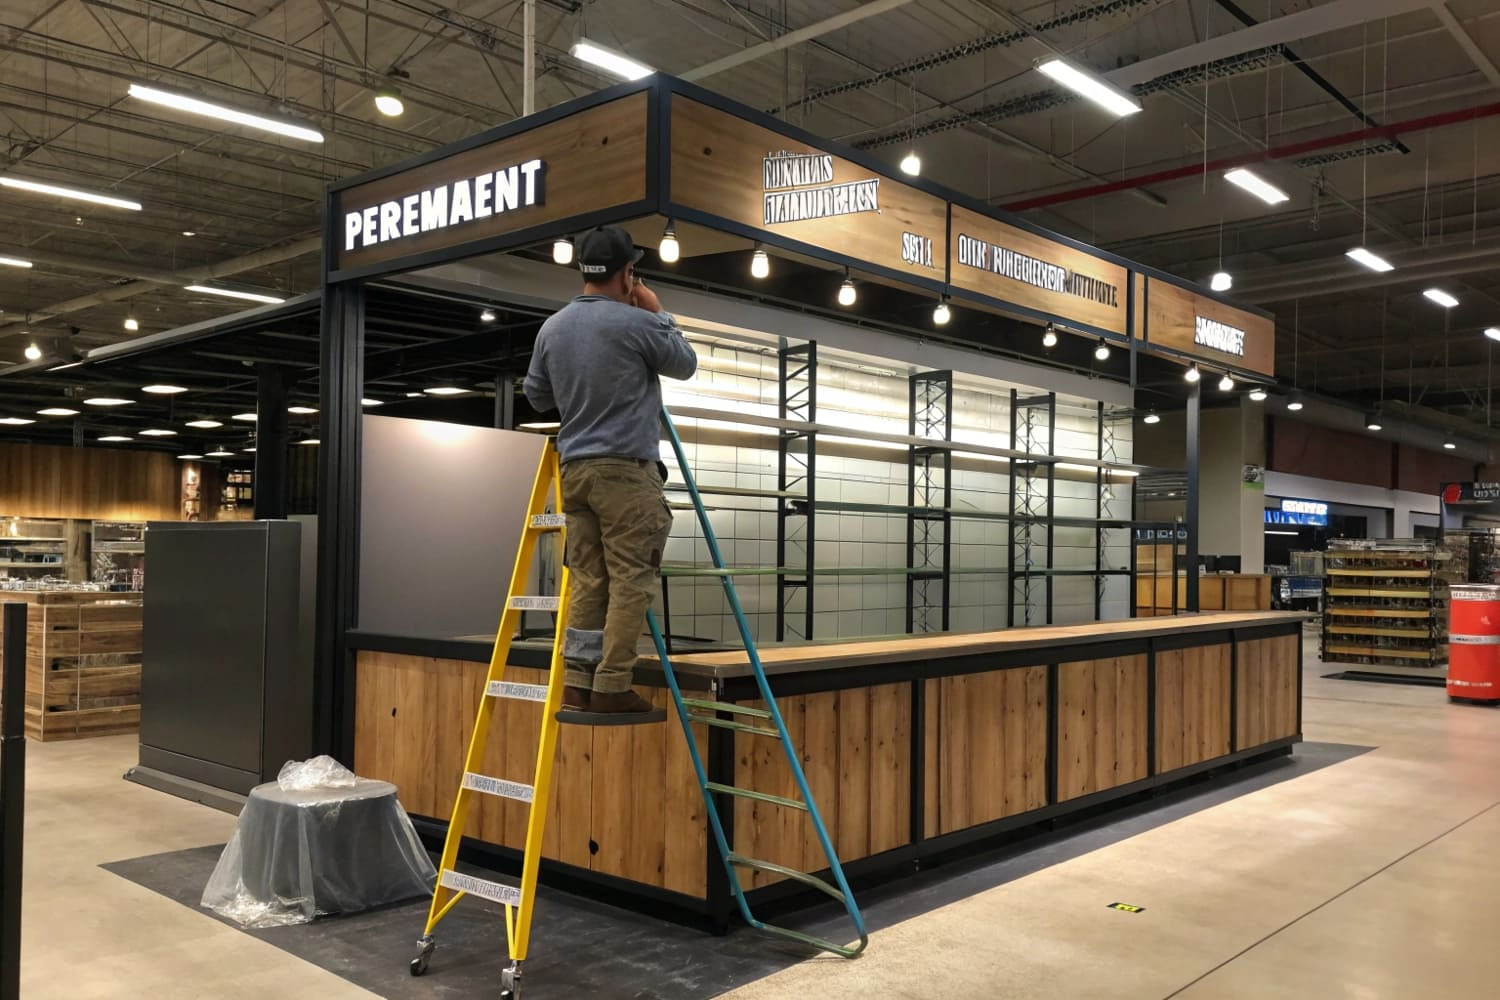
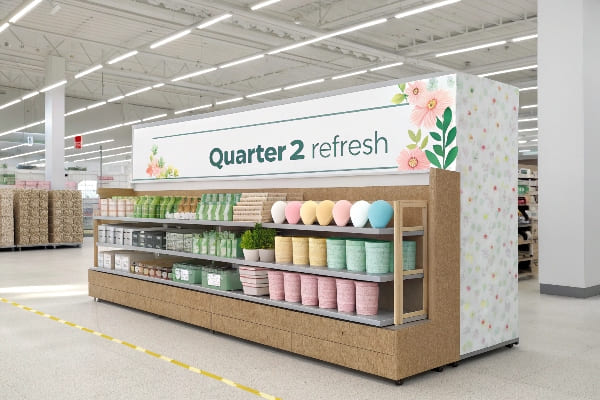
Refresh permanent in-store displays every six months, seasonal cardboard or end-cap units every quarter, and fast-turn promotional table-tops every four to six weeks. Window displays need the quickest rhythm—swap elements each two weeks and fully reset monthly.
Customers may leave if they think nothing ever changes. Keep them curious by promising the next surprise just around the corner.
Why is it important to maintain displays?
Stagnant shelves send a subtle message: “We stopped caring.” That thought grows, and soon carts stay empty.
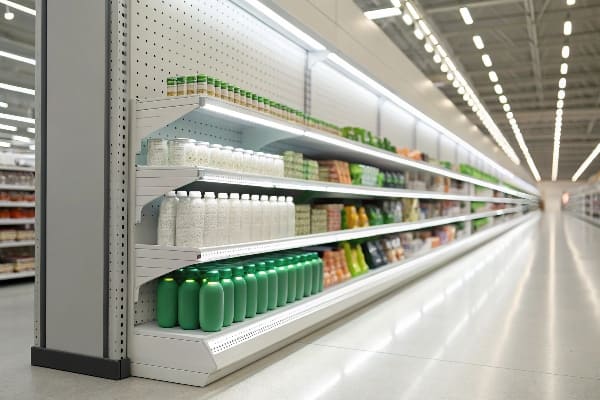
Well-kept displays protect product, uphold brand trust, and drive impulse buys that old, dusty setups lose within days.
The Three Pillars of Display Care
My factory in Guangzhou prints bright crossbow graphics for David’s Barnett Outdoors line. I inspect every batch because a scuffed edge means lost credibility at his hunting shows.
| Pillar | What I Do | Result for Buyers |
|---|---|---|
| Surface Clean | Wipe, replace torn graphics | Products look fresh |
| Structural Check1 | Test load strength weekly | No mid-season collapse |
| Graphic Update | Swap price or promo logos | Keeps message on point |
Routine vs. Reactive Maintenance
Routine work2 is my calendar rule. Each Friday, line leaders log photos of floor stands in the warehouse. If bulges form near the base, I schedule a quick reinforcement using thicker E-flute sheets. Reactive action costs more time; one winter we ignored a small wobble and a pallet of compound bows toppled. The repair ate two days and delayed shipment to Kansas. Lesson learned: planned touch-ups prevent emergency rebuilds, saving freight and goodwill.
Hidden Profit3
A polished display lifts average order value. After I introduced a monthly POLY coat wipe-down, a pet-food client saw a 7 % rise in upsells because the aisle looked brighter. Maintenance may feel like expense, but it is margin in disguise.
What is the psychology of window displays?
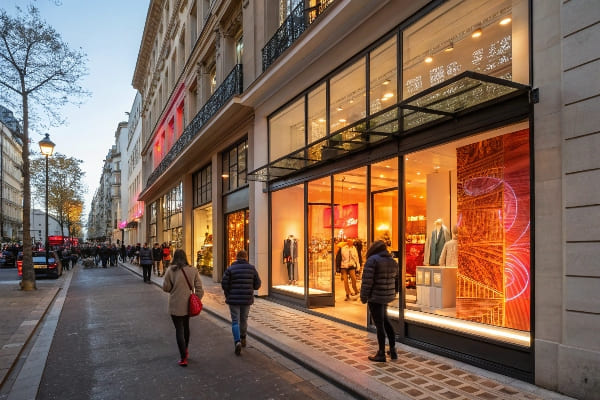
People do not plan to stop. We must intercept their journey and seed a new desire in three seconds.
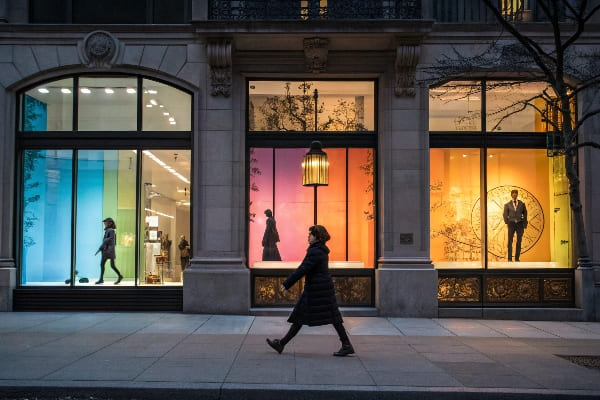
Window displays trigger approach behavior through contrast, motion, and story; they hook by mirroring a shopper’s dream state and offering instant resolution inside the door.
Hooks That Pull Shoppers In
I once framed Barnett’s new crossbow behind frosted acetate, then cut a clear arrow path leading to a glowing target. Passersby paused, traced the line, and many walked inside.
| Psychological Cue | Simple Tool | Effect Measured |
|---|---|---|
| Contrast | Matte black vs. neon orange | 28 % more footfall4 |
| Motion | Slow-turning platform | Doubles dwell time5 |
| Story | “Ready-to-Hunt” scene | Higher recall in survey |
Contrast
Start with color. My cardboard engineers print CMYK but reserve a single Pantone spot to pop. A deep forest green wall paired with lime text makes hunters halt.
Motion
Even a cheap rotating riser gives life. The eye tracks movement first. I set the speed to one rotation every ten seconds—enough to notice, not dizzy.
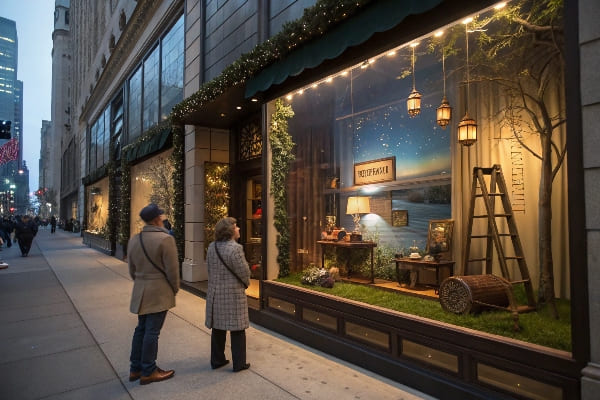
Story
A bow without context is a tool. Place it beside faux leaves, a trail camera, and a tiny placard: “From box to buck in one hour.” The shopper completes the narrative in his head and steps inside to make it real.
How effective are window displays?
Display budgets fight for attention with ads, influencer posts, and SEO. We must prove the storefront still wins.
Measured by conversion lift, a well-executed window can raise walk-in traffic by 20 – 40 %, translating to double-digit revenue growth on launch weeks.
Metrics That Matter
I track numbers because my B2B buyers demand proof before reordering.
| Metric | Method | My Benchmarks |
|---|---|---|
| Footfall6 | Door sensor | +30 % after refresh |
| Dwell Time | Heat map camera | 12 s average |
| Conversion | POS tags vs. door count | 18 % baseline |
Test-and-Learn Loop
I run A/B tests7 with two identical malls. One store gets a fresh themed display. The other keeps last month’s. After one weekend, the updated store logged 470 more entries. That data earned us a three-year supply contract.
ROI Breakdown8
A cardboard window kit costs $480 landed in Chicago. Extra sales from one month of uplift often exceed $5,000. Payback happens in roughly three days. Share numbers like these with procurement teams—hard math quiets budget doubts.
Long-Tail Value
Beyond immediate lift, new windows feed social media. Customers snap photos, post them, and extend reach at zero cost. My displays have appeared in unplanned TikTok clips, creating viral loops the ad team cannot buy cheaply.
What is the theory of window display?
Behind every stunning scene is a framework. Knowing it turns art into a repeatable system.
The “SEE” theory—Stop, Engage, Encourage—structures each window: first arrest attention, then invite deeper look, finally nudge action toward the entrance.
Anatomy of the “SEE” Framework
I teach new designers this model during factory tours.
| Stage | Goal | Example Element |
|---|---|---|
| Stop | Interrupt movement | Flashing LED outline |
| Engage | Hold gaze, spark thought | Interactive QR target |
| Encourage | Direct next step | Floor arrow to aisle |
Stop
Use scale or light. For Barnett, an oversized broadhead replica9 sliced through the glass, lit from inside. Commuters physically halted.
Engage
Give them a puzzle. One window hid half the bow in shadow. People leaned closer. Proximity builds connection.
Encourage
Clear prompts matter. A red-tipped arrow sticker10 ran from the foot of the mannequin to the open door. Sales staff later reported guests literally following it inside.
From Theory to Practice
I revisit SEE each time I plan my update calendar. If an element no longer achieves its stage, out it goes. Theory is not abstract; it is a checklist taped beside my workbench.
Conclusion
Update displays on a set rhythm, test results, and follow the simple SEE steps—sales will keep rising while costs stay low.
Learn the best practices for structural checks to ensure safety and reliability in your production process. ↩
Understanding routine maintenance can help improve efficiency and prevent costly repairs in your operations. ↩
Discover how recognizing hidden profits can enhance your business strategy and boost your bottom line. ↩
Understanding footfall can help retailers optimize their strategies to attract more customers and increase sales. ↩
Exploring dwell time can provide insights into customer engagement and improve store layouts for better sales. ↩
Understanding footfall can help you optimize store layouts and improve customer engagement, leading to increased sales. ↩
A/B testing allows retailers to make data-driven decisions, enhancing customer experience and boosting sales effectively. ↩
A clear ROI breakdown helps justify marketing expenses and demonstrates the value of investments to stakeholders. ↩
Learn how oversized elements like broadhead replicas can effectively capture attention and interrupt movement in design settings. ↩
Discover the importance of clear visual prompts in directing customer flow and enhancing the shopping experience. ↩